Visualizing Flight Data: DELTA Airlines
- Nov 29, 2021
- 3 min read
Updated: Jul 26, 2023
Topics: Tableau, Linear Regression, Business Intelligence

The human brain is wired to process visual information far more easily as compared to spreadsheets or tables of data. Consequently, as a data scientist, one of the key skills you should possess is being able to communicate the data that you analyze in an engaging way and one of the most popular tools for doing it is Tableau.
I took a data set comprised of Delta flights and their details such as departure and arrival times, departure and arrival airports, cancelled flights and so on. Before I started working on it in Tableau, since the data was so rich and varied, I decided to narrow down on the specific topic of departure delays and examine the accompanying patterns.
PART 1: Cities vs. Timings vs. Seasonality
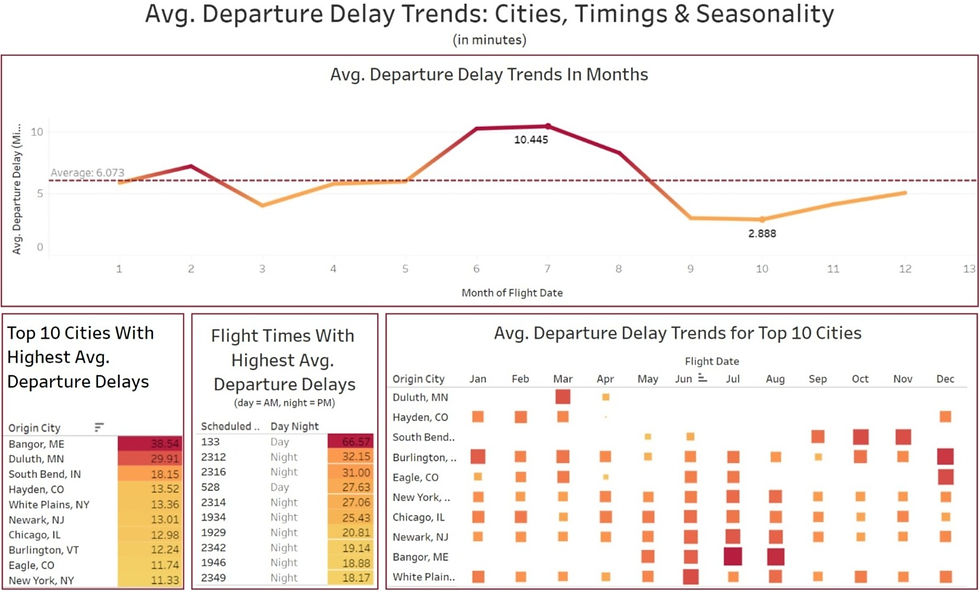
When I started the analysis, my focus was to understand what factors affect departure delays. An immediate and intuitive answer was to examine criteria like airports/cities, flight timings and seasonality because these usually affect flight delays (they serve as proxies for other factors - for instance, cities can be a proxy for weather, so perhaps cities with heavy snowfall experience more delays). From the dashboard, there are a couple of insights we can draw instantly:
a. In terms of seasonality, the summer months clearly experience more delays.
b. While we can see the specific timings that lead to the longest delays, I went ahead and classified them into day and night for more context. As we can see, on average, night flights experience longer departure delays as compared to day flights.
c. In terms of cities, airports in Maine, Minnesota, Indiana, Colorado, New York, New Jersey, Illinois and Vermont experience the longest departure delays on average.
PART 2: Distance Travelled vs. Plane Carriers
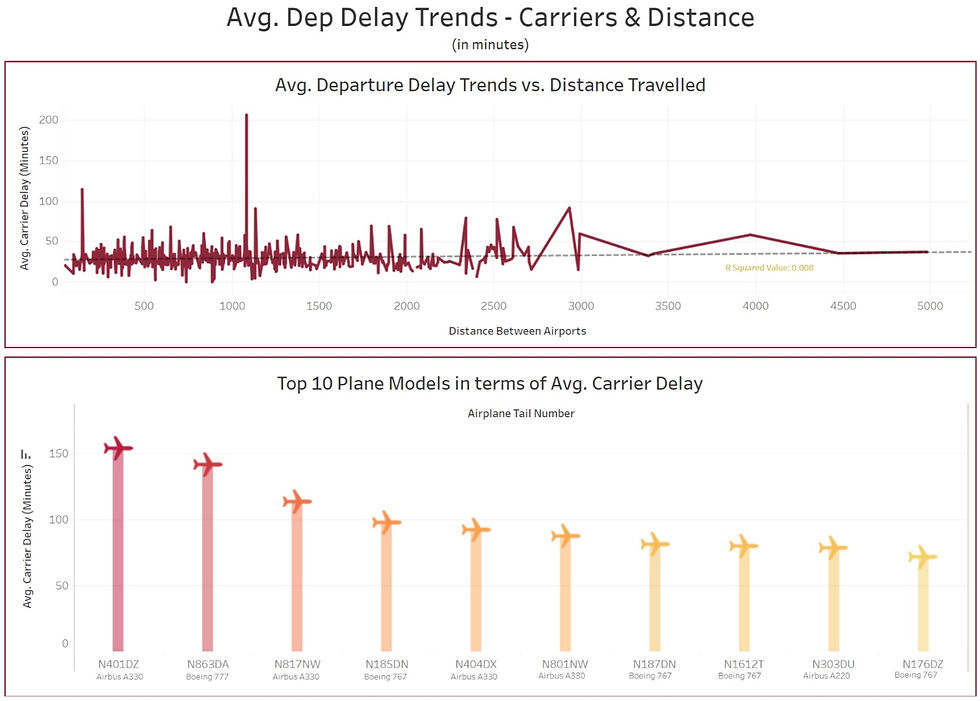
The next step was to look at factors that might affect departure delays but are not obvious, such as the distance travelled by the plane and the specific model of the plane. From the dashboard, what we can conclude is:
a. There is no clear relationship between distance travelled and departure delays. The highest delays seem to occur randomly around the 1000 kilometers mark. For further clarity, I also looked at the linear regression model and the R squared value which was quite small and closer to zero (0.008).
b. In terms of the plane models, I looked at the longest average departure delays and the models that caused them. For additional context, I did a bit of research and found out what specific Airbus/Boeing models they were. As shown, Airbus seems to cause longer delays in comparison to Boeing, especially the A330.
PART 3: Reliability
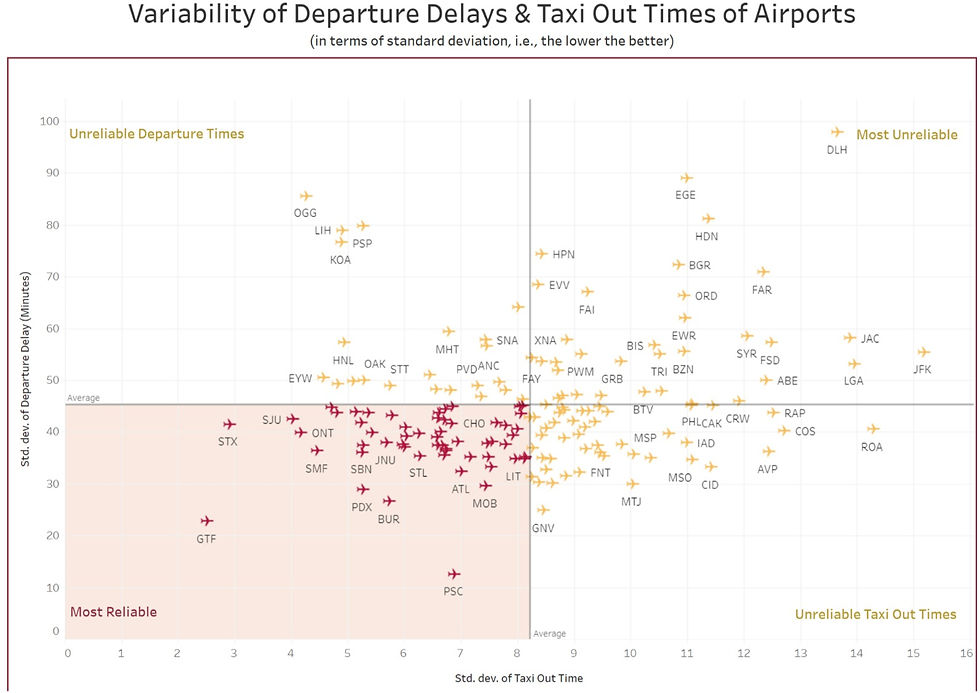
Given that I had looked at all these factors leading to departure delays, I now wanted to look at the other side of the coin. Which airports were the most reliable when it came to delays in terms of departures or taxi out times? Looking at the standard deviation of these two values was the best way to plot the consistency (the lower the standard deviation, the more consistent they are).
Evidently, Henry E. Rohlsen Airport (US Virgin Islands), Great Falls International Airport (Montana) and Tri-Cities Airport (Washington) are some of the most consistent airports.
Long Story Short:
Grasping dashboards and charts should ideally be straightforward and simple to interpret. However, if this was all still a bit complex to understand, the key takeaways are the following:
a. Seasonality, airport cities, flight timings and plane models seem to affect the length of departure delays.
b. Distance travelled by the flights is unlikely to affect the length of departure delays.
c. Henry E. Rohlsen Airport (US Virgin Islands), Great Falls International Airport (Montana) and Tri-Cities Airport (Washington) are airports that are quite consistent in terms of flight delays.
You can access my visualizations on my Tableau profile: https://public.tableau.com/app/profile/anamika.singh6017
Comments